
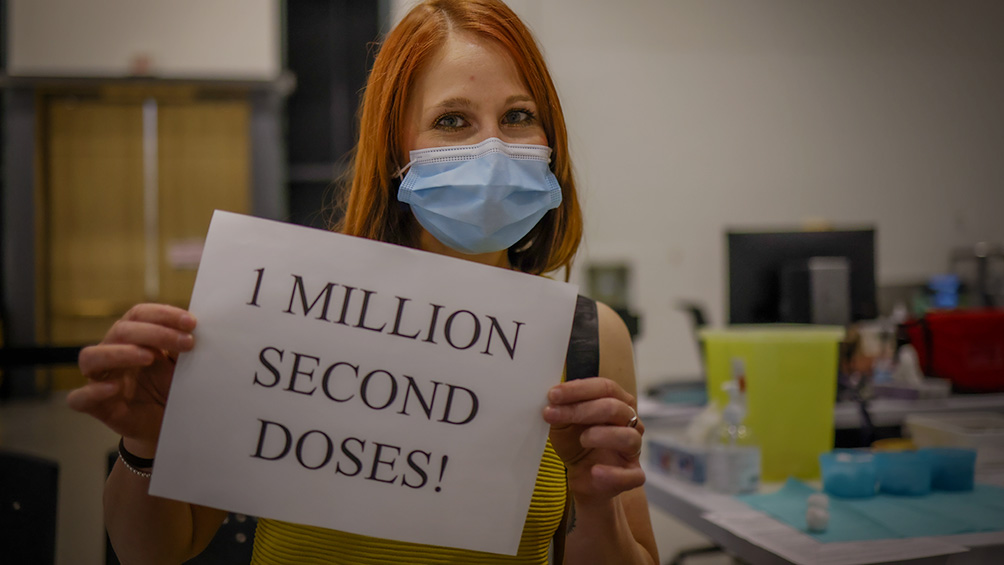
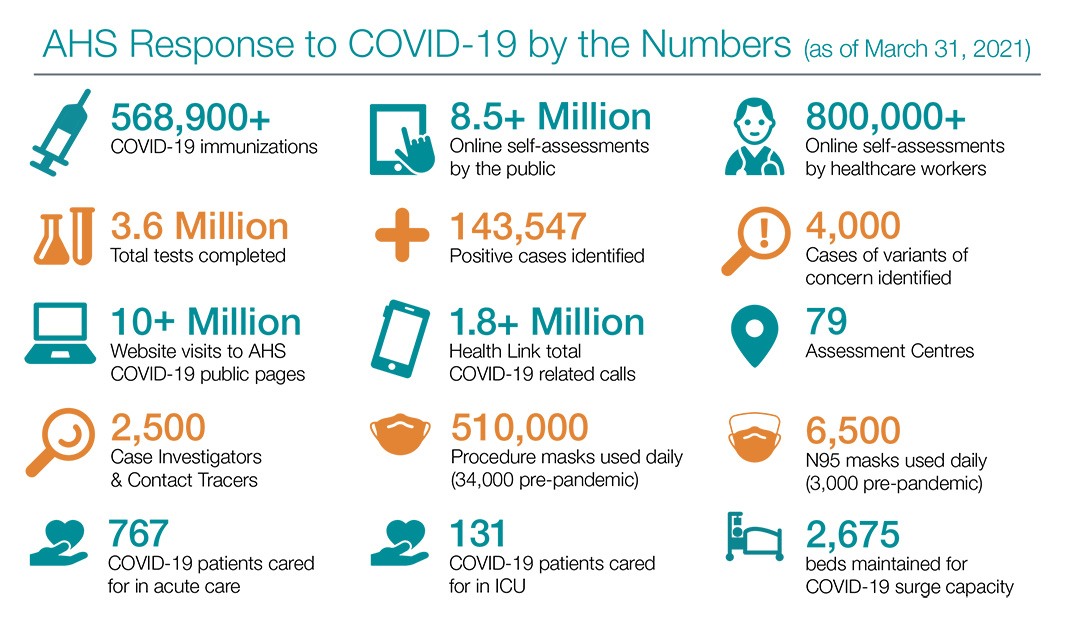
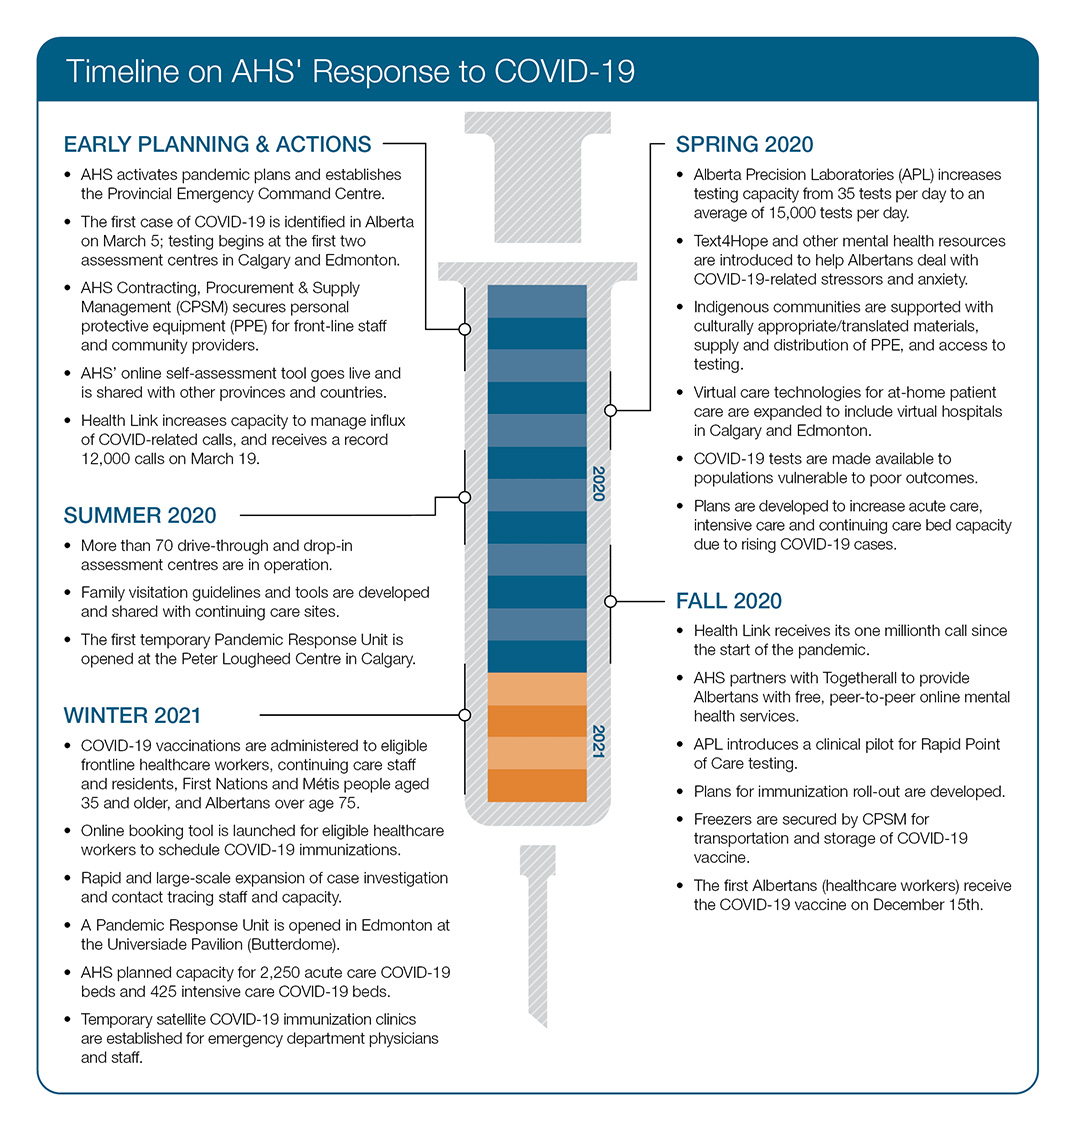
The COVID-19 pandemic has placed significant demands on AHS and our workforce that have never been experienced before. The strength of our COVID-19 response has been grounded in our ability to work as part of an integrated provincial team. This structure allowed AHS to take swift, strategic and innovative action. AHS continues to take precautions to reduce the spread within Alberta, while aggressively responding to outbreaks and ongoing pandemic activity.
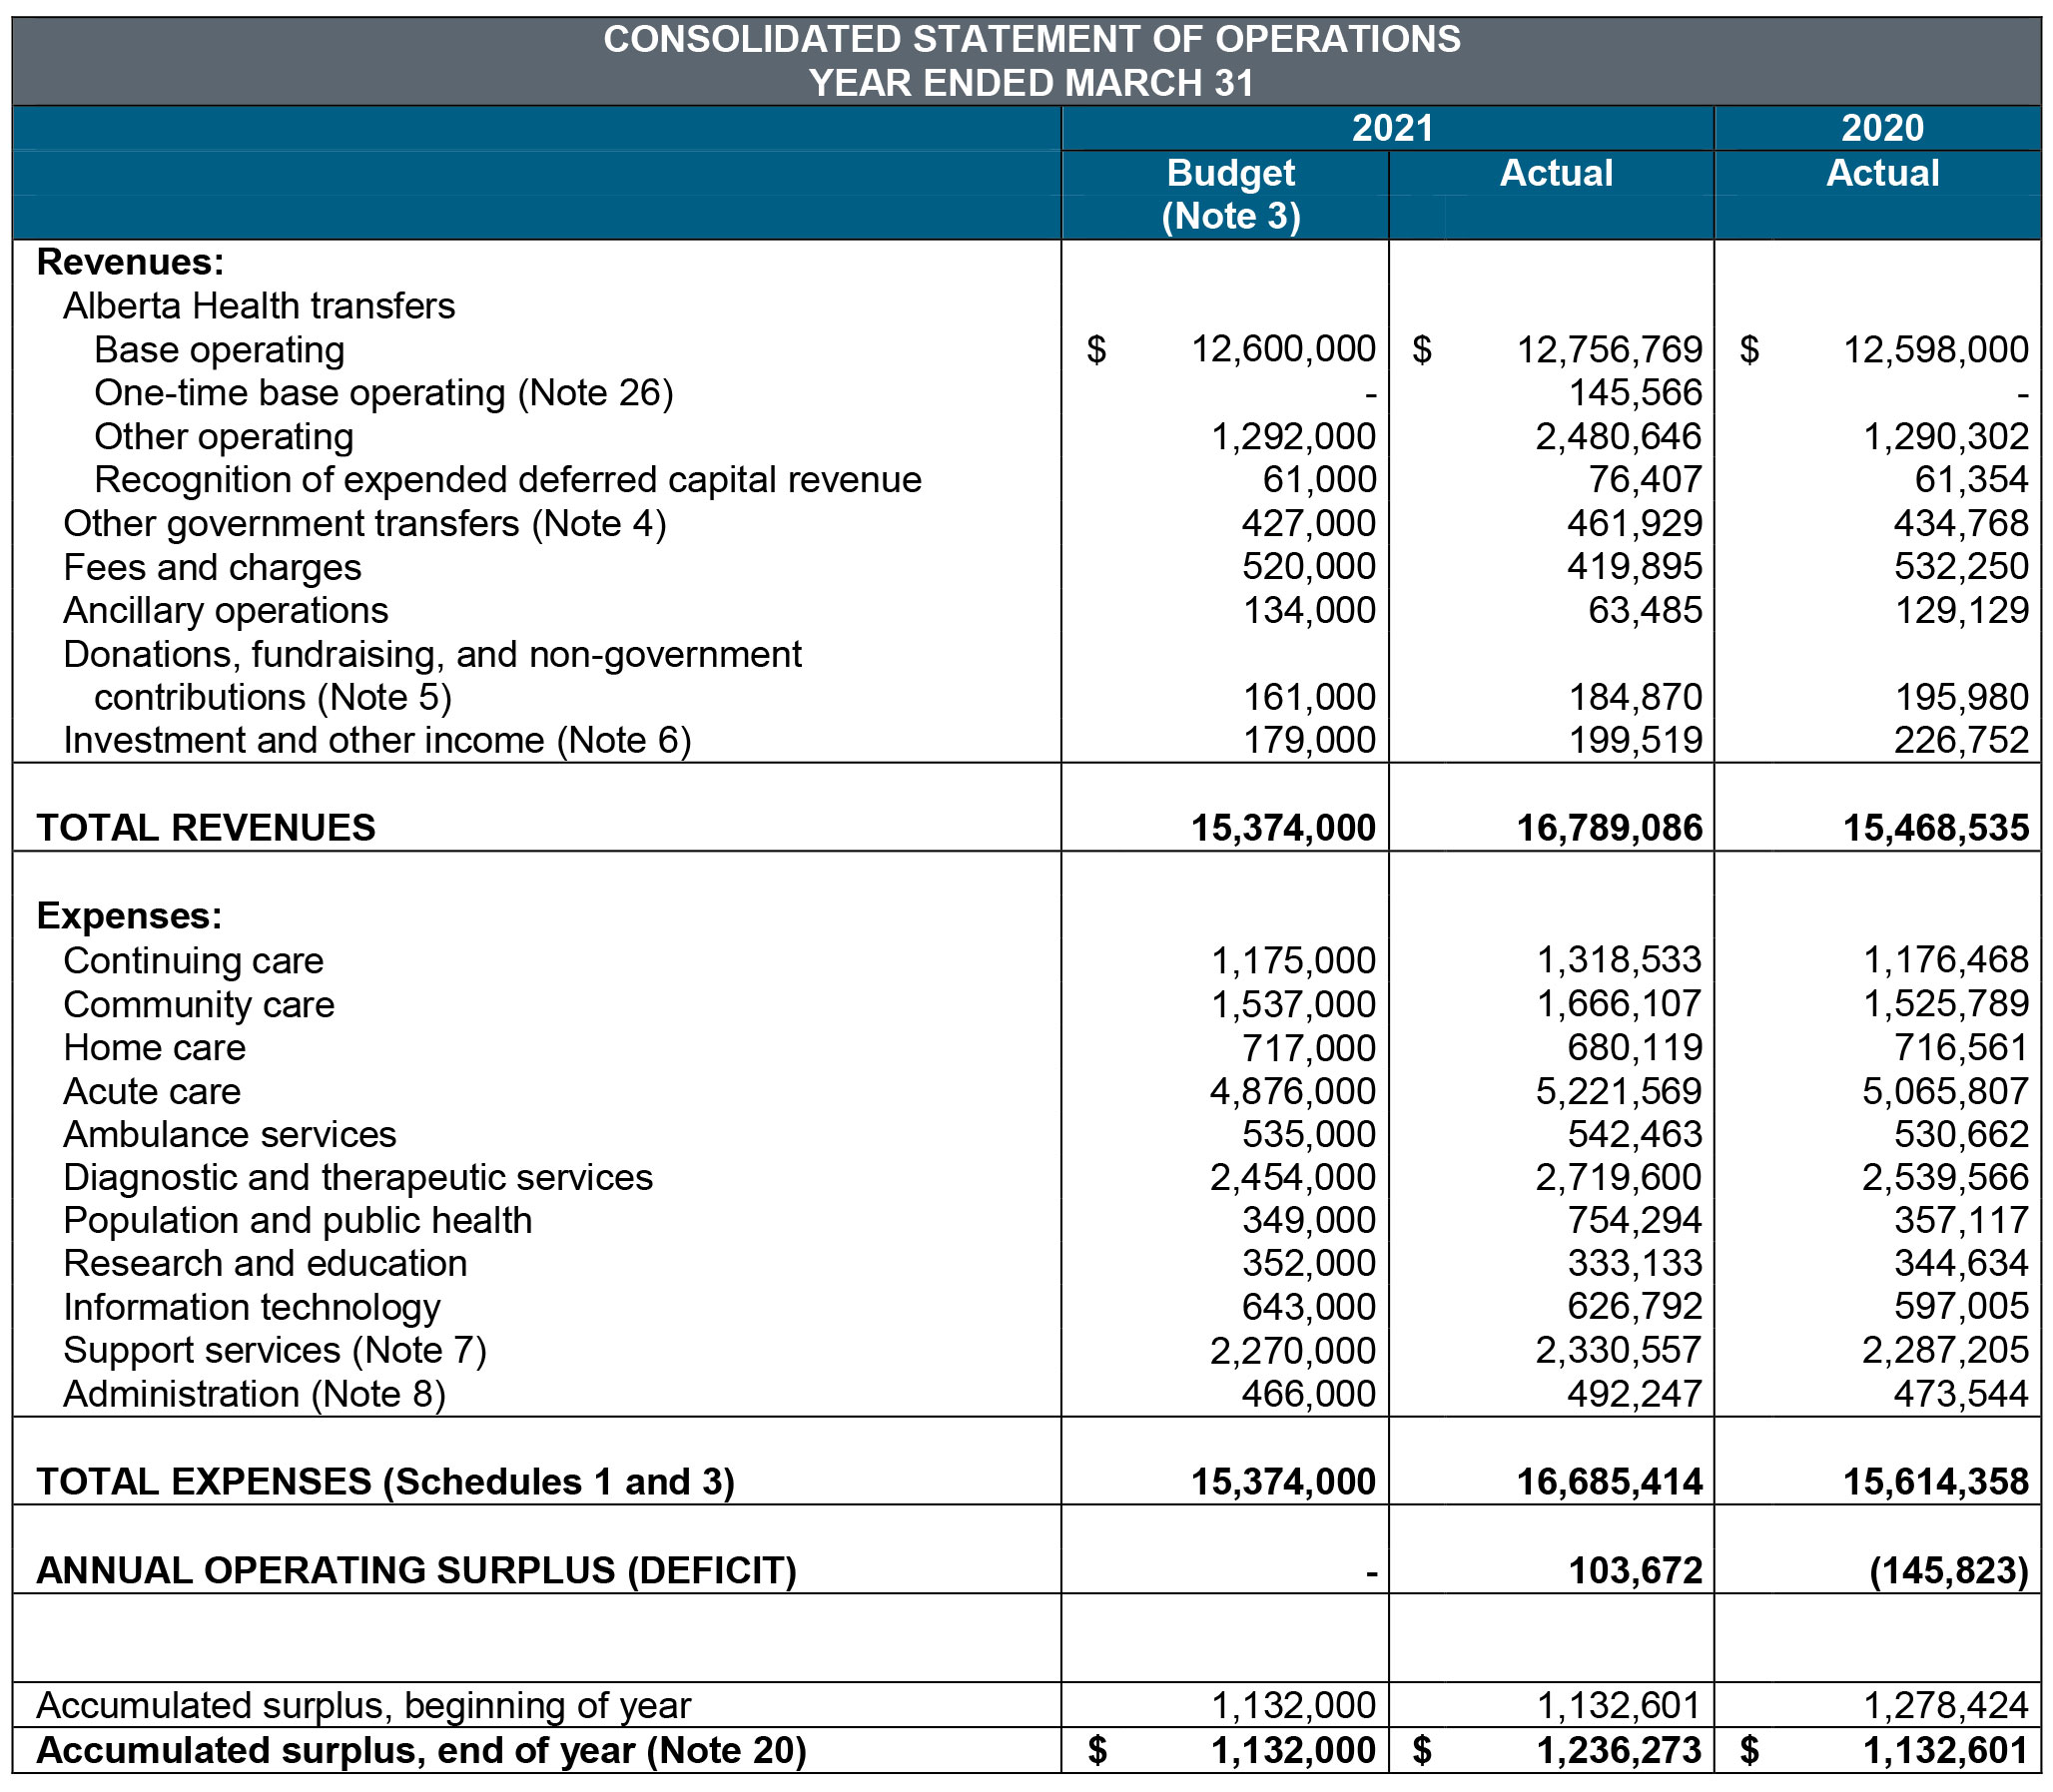
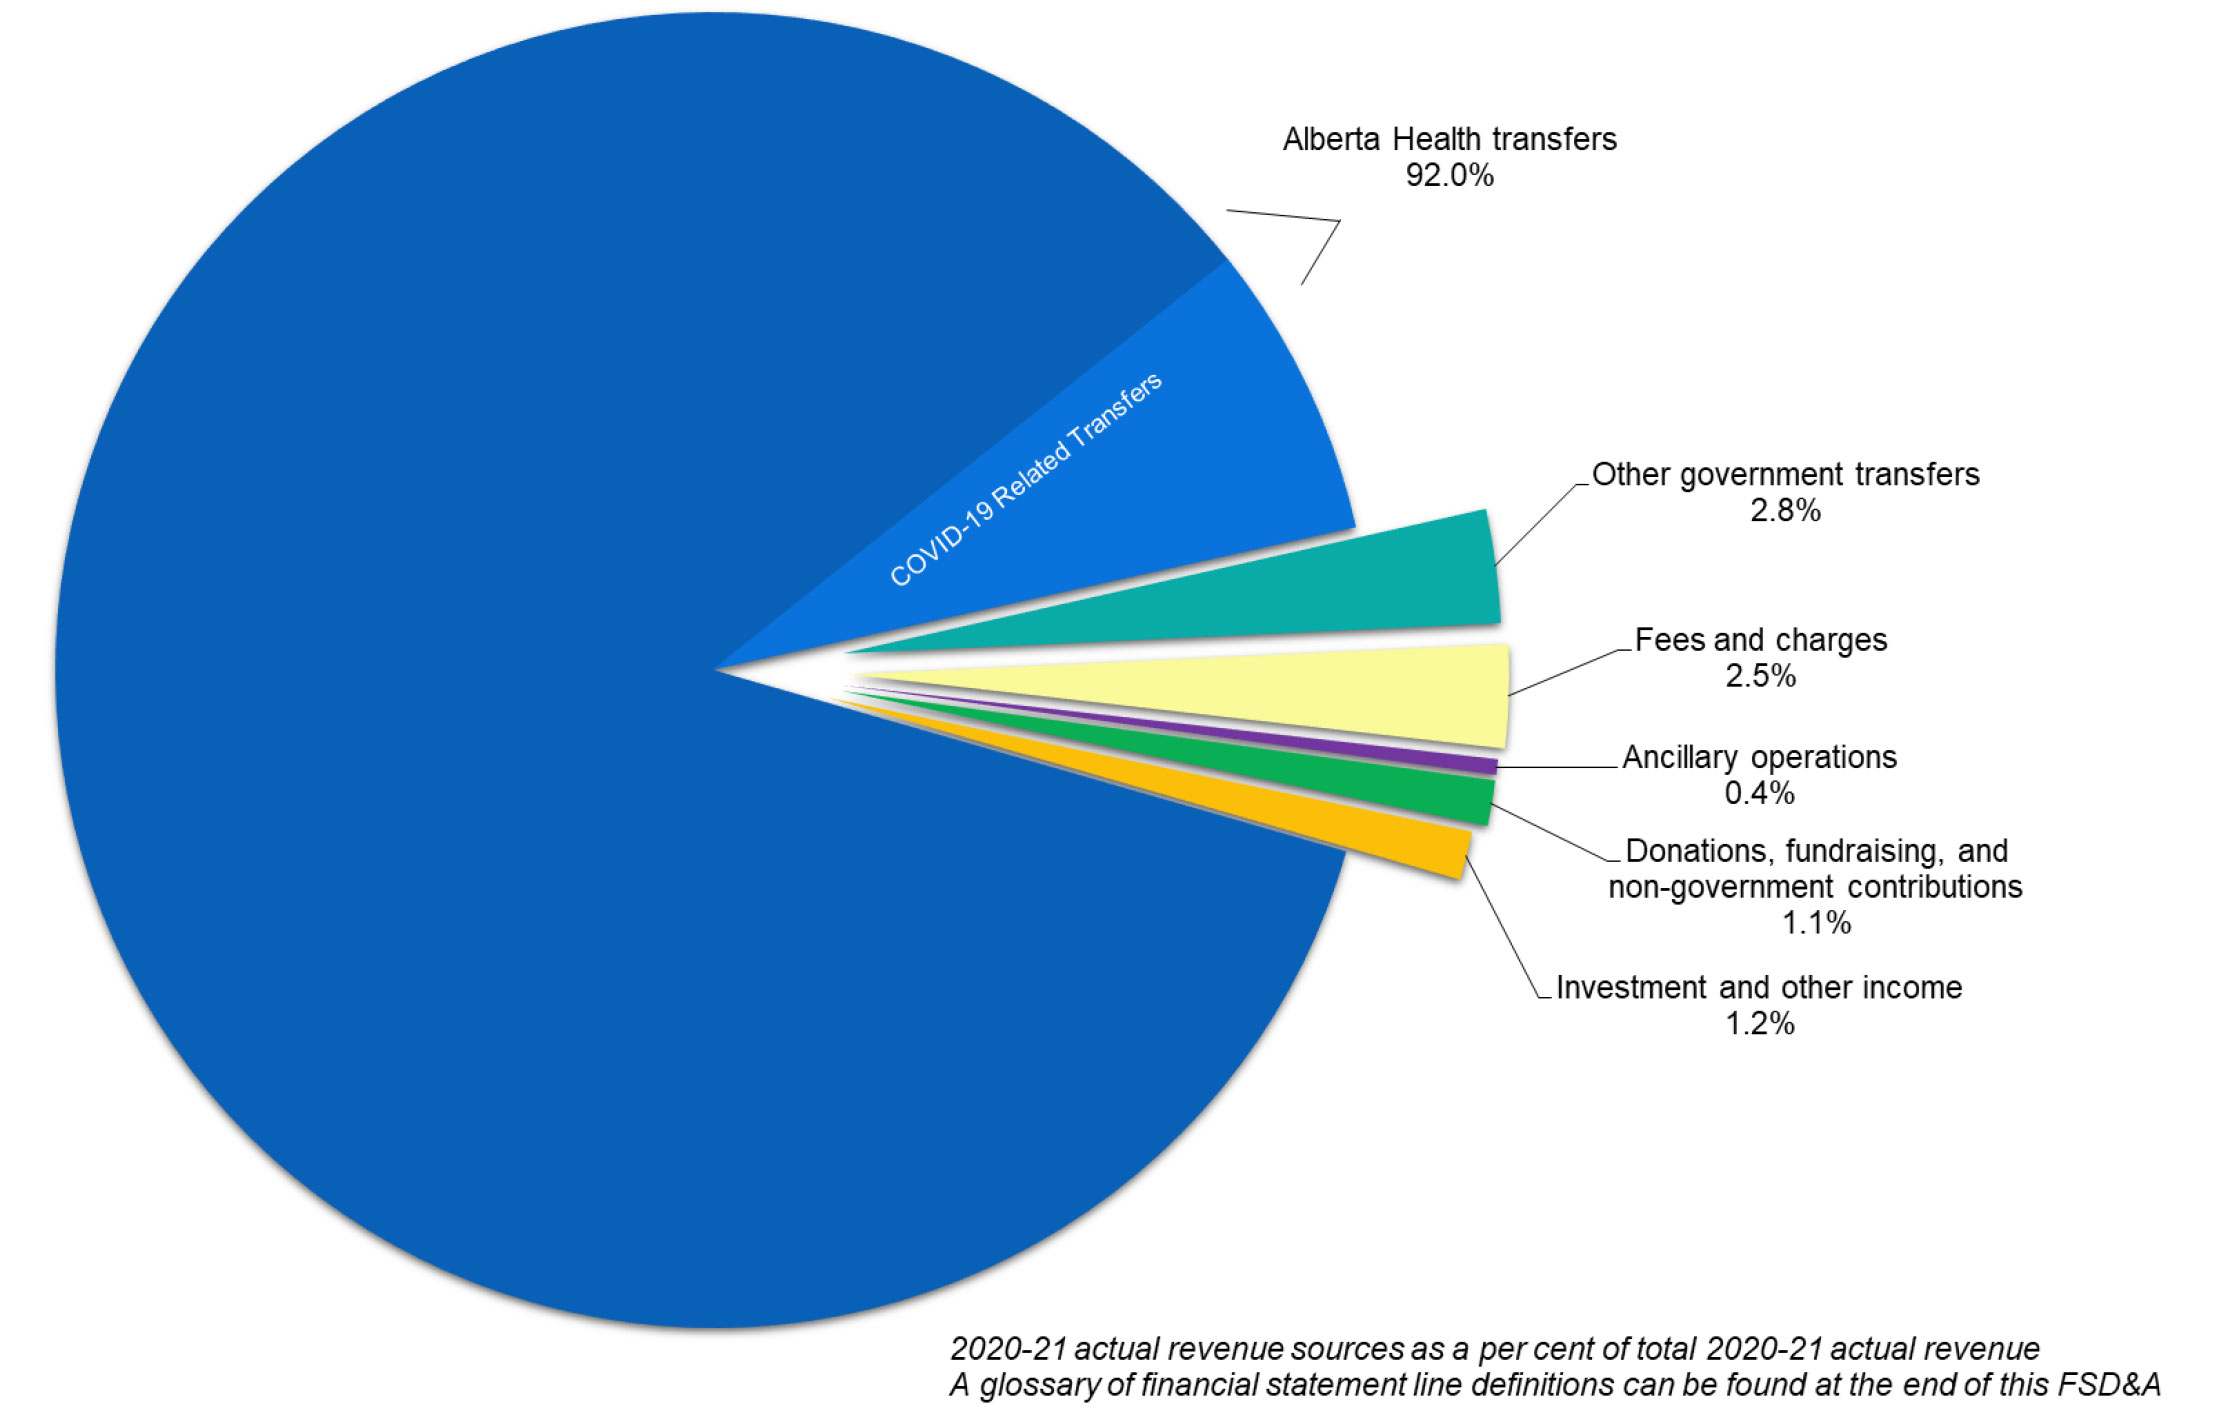
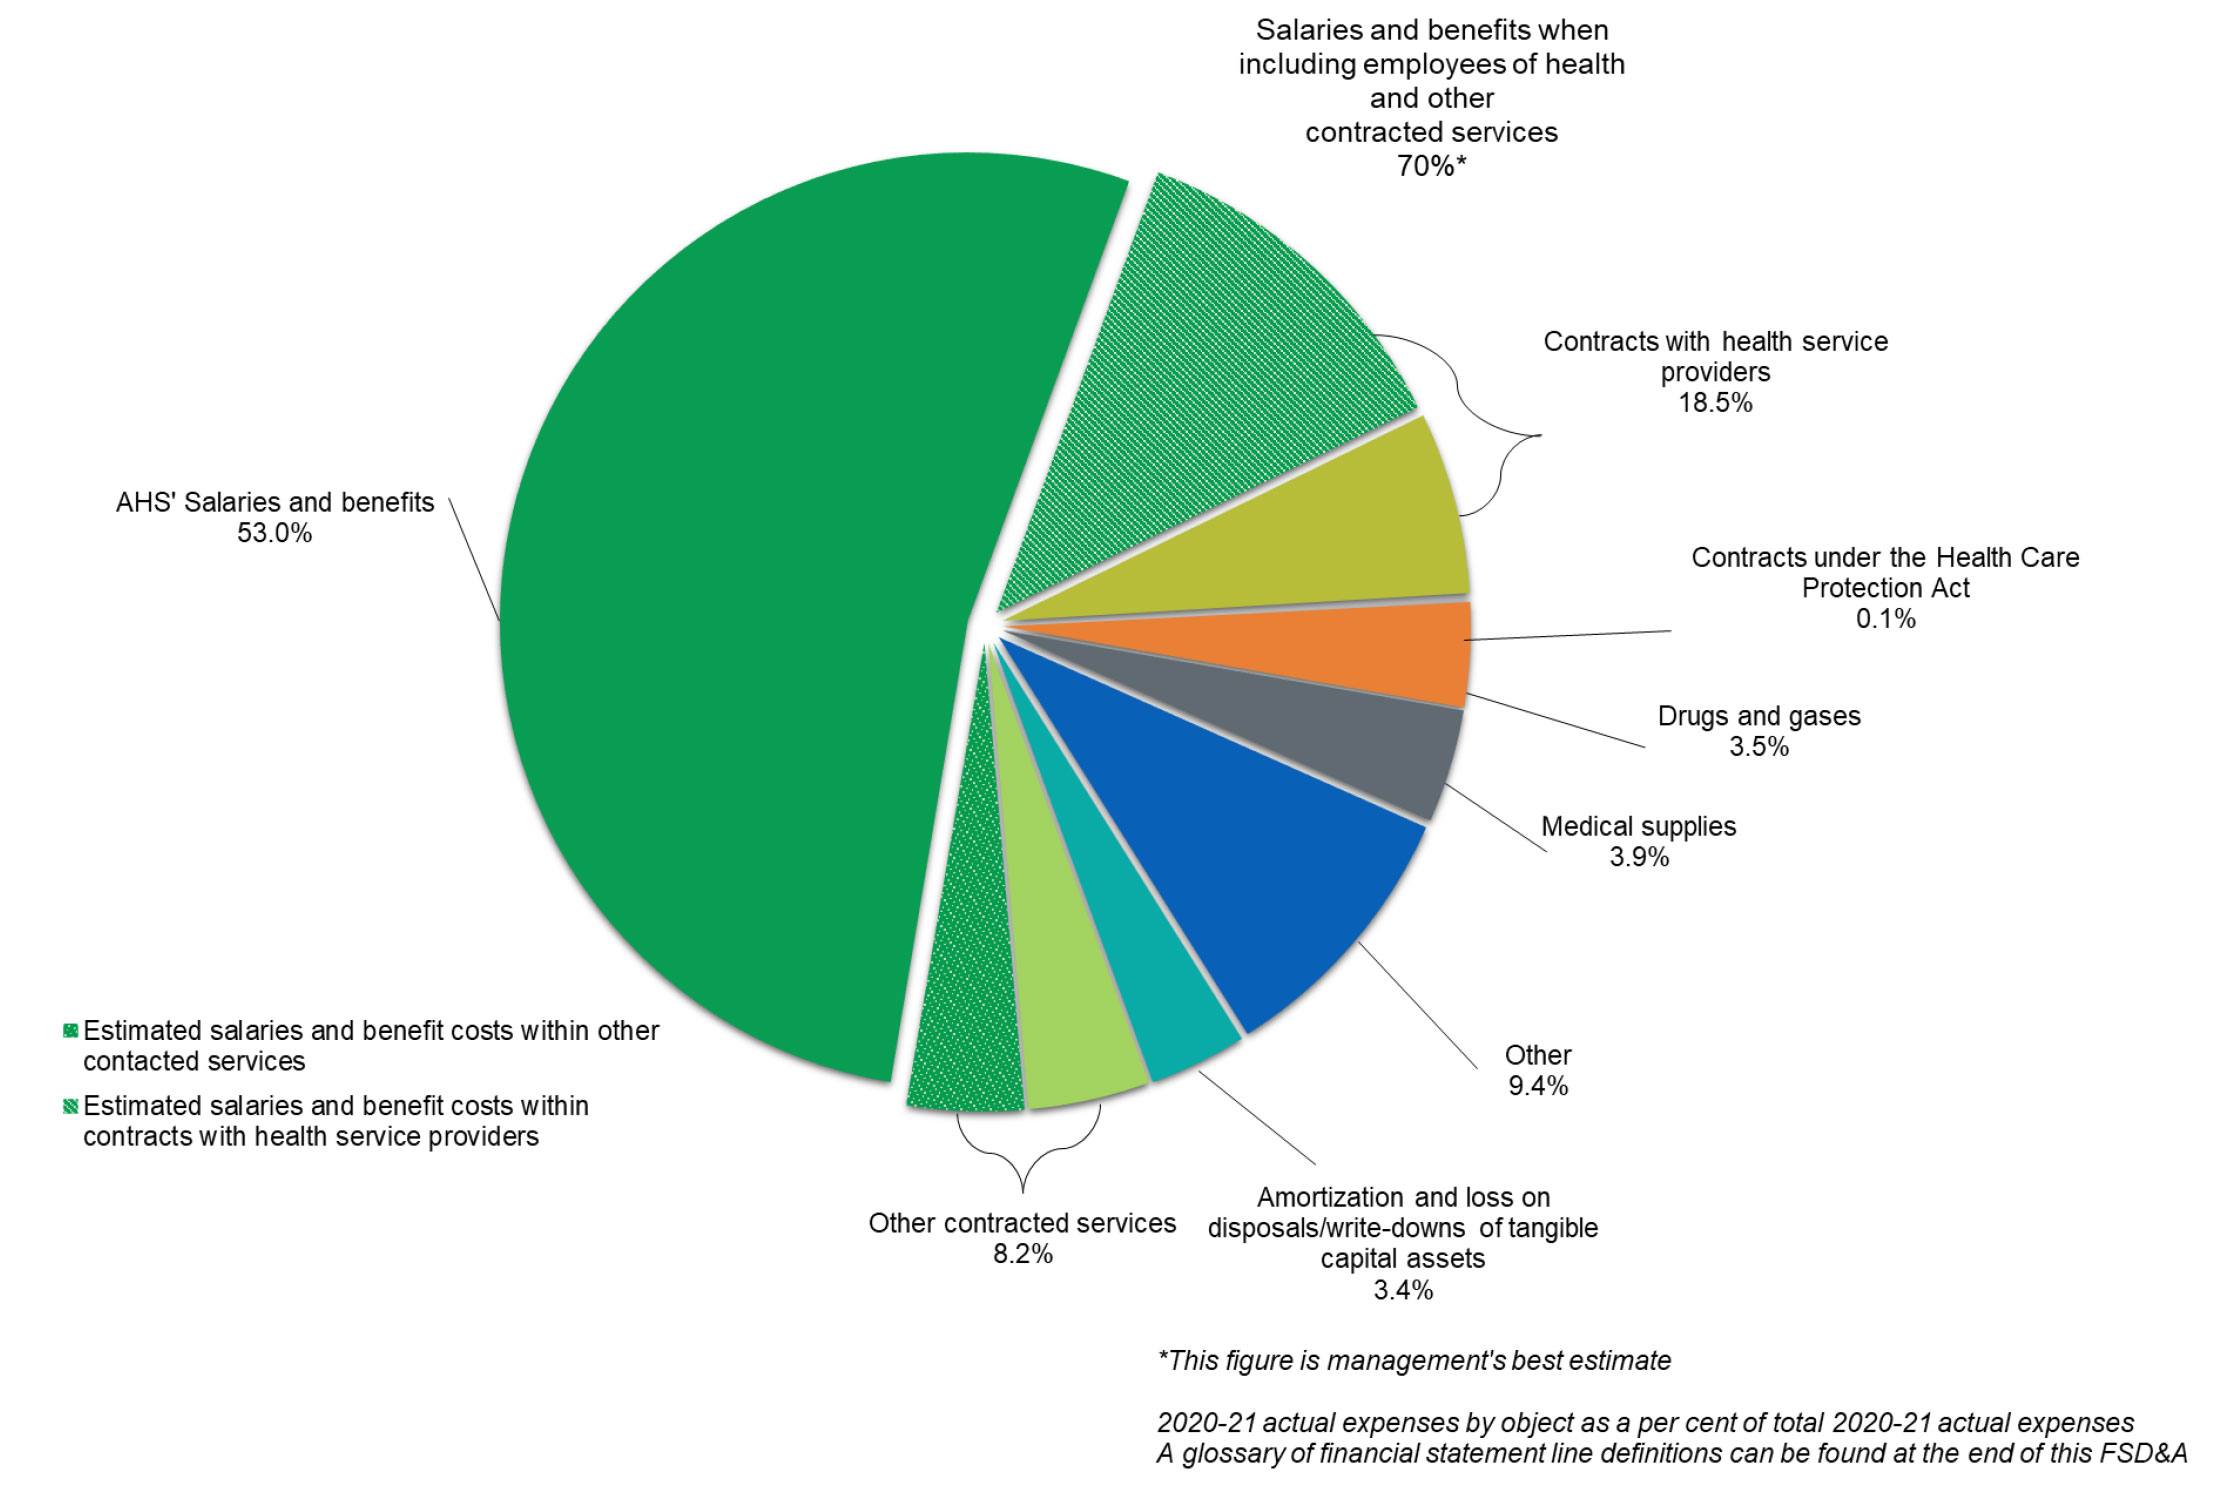
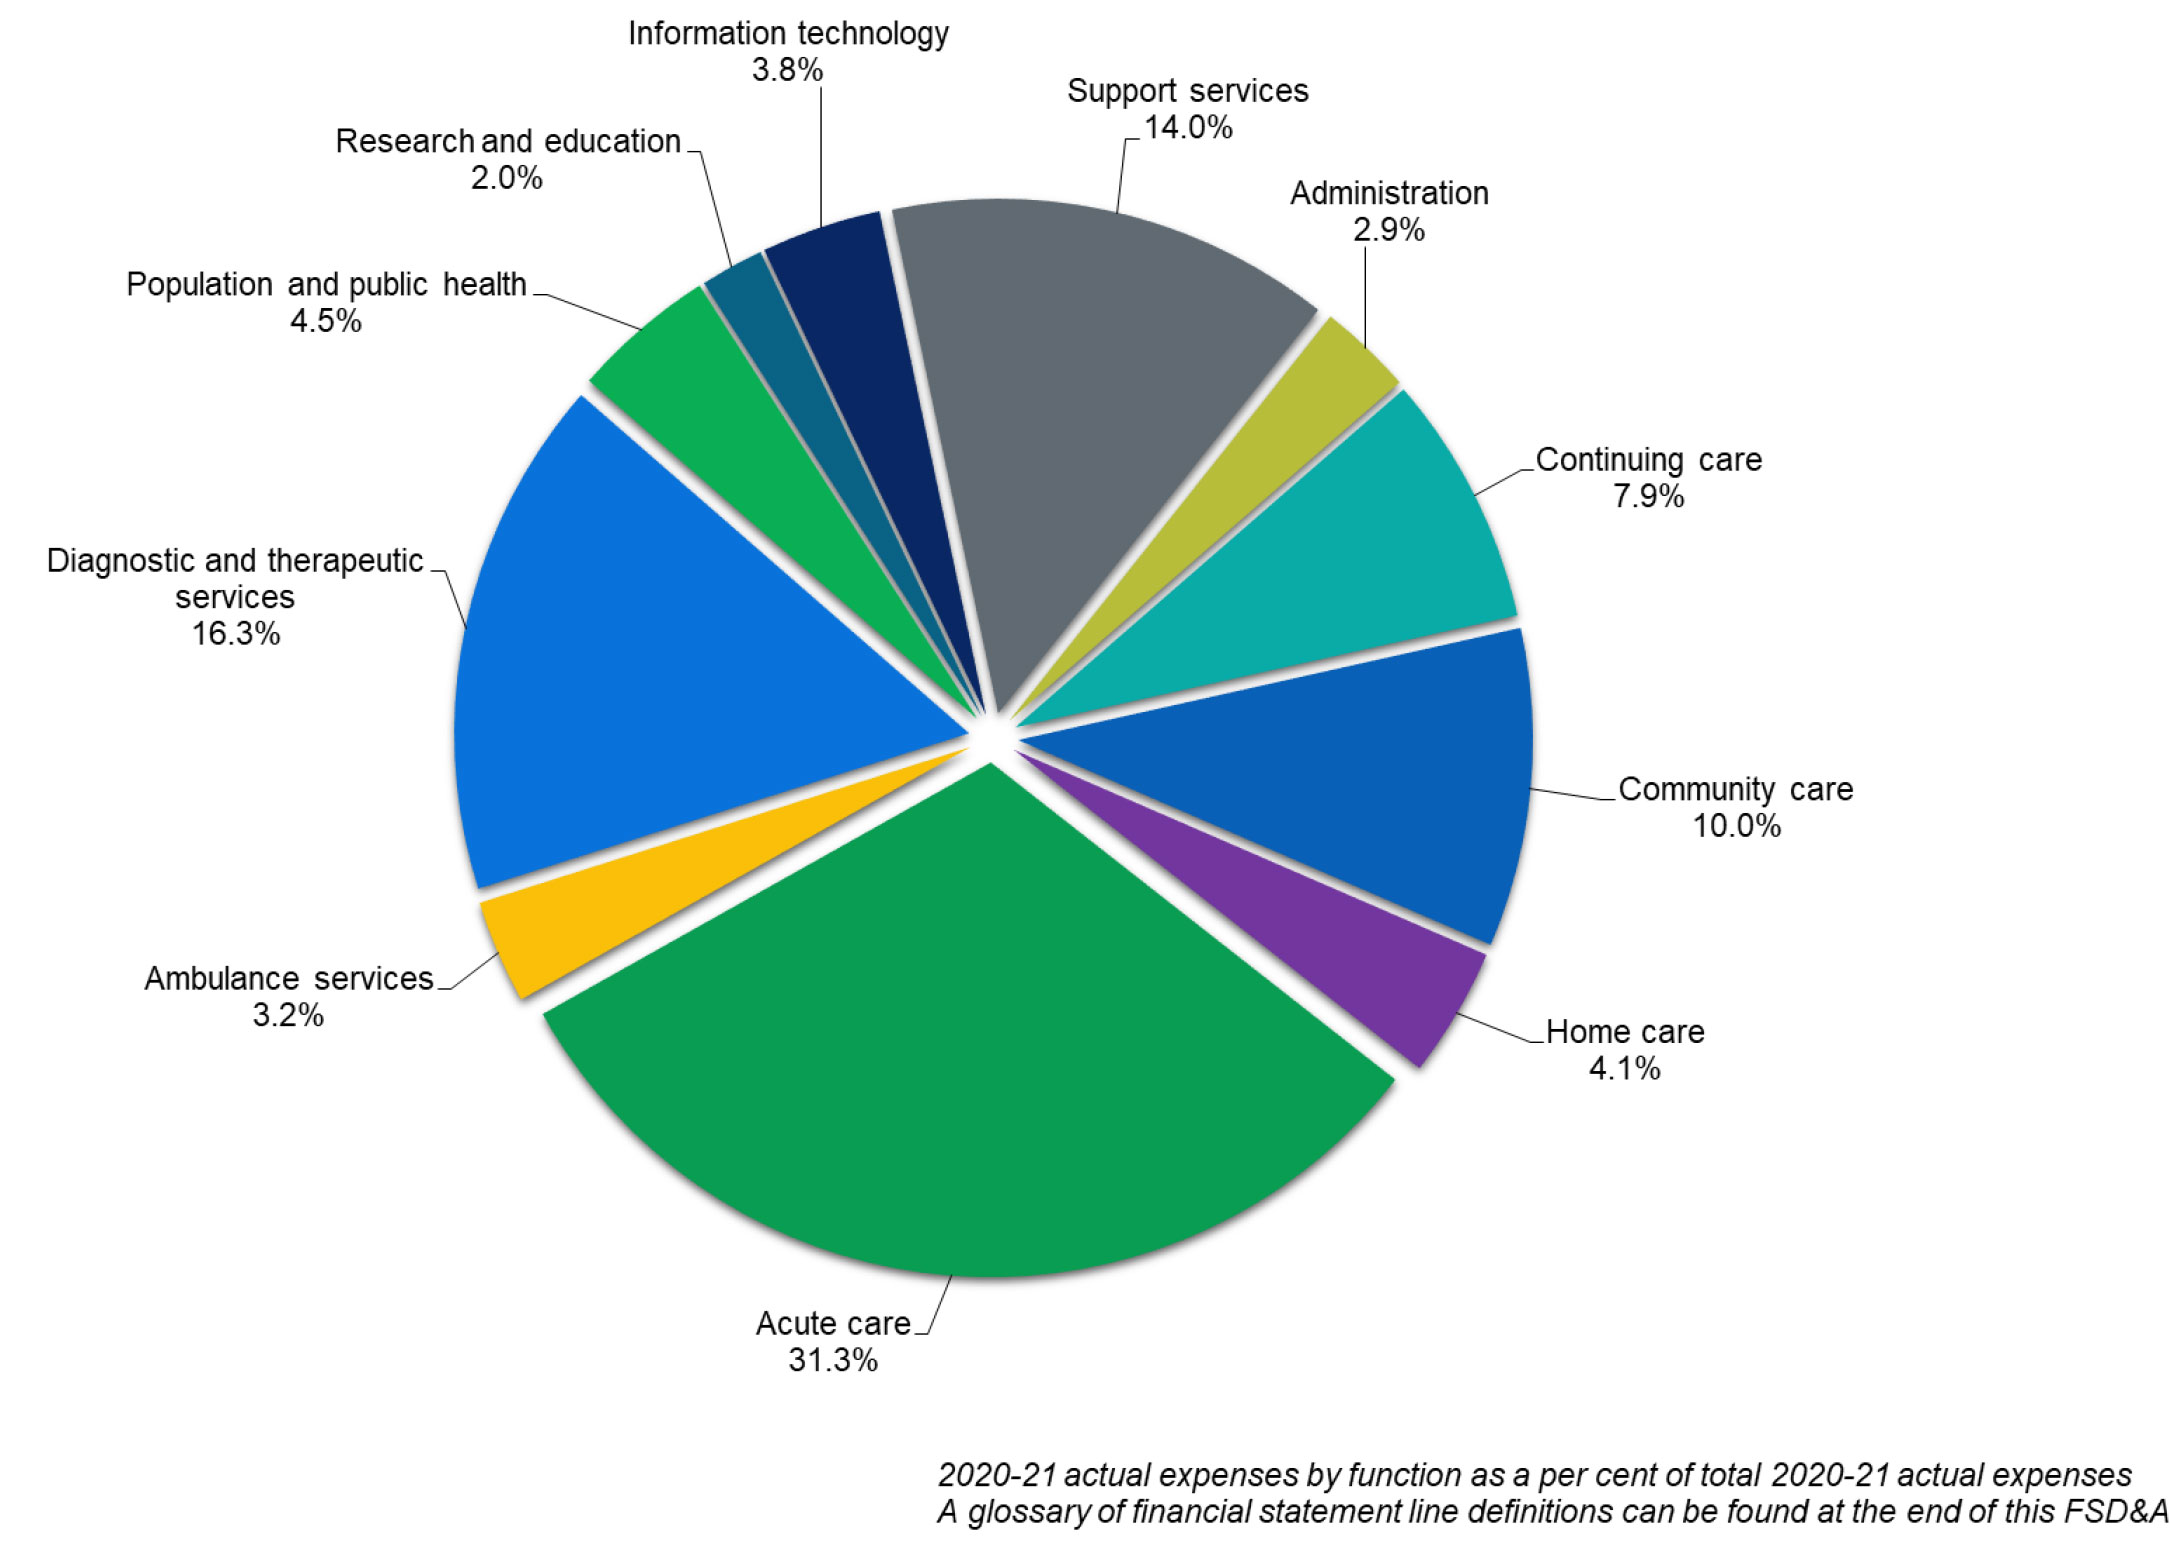
The following information are excerpts from the March 31, 2021 audited consolidated financial statements and Financial Statement Discussion and Analysis.
There are a number of measures AHS tracks to help inform performance across the healthcare delivery system. These measures include a broad range of indicators that span the continuum of care, such as population and public health, primary care, continuing care, mental health, cancer care, emergency department and surgery. The measures below include what we historically have called Monitoring Measures, and also include measures we are considering as part of the draft 2020-24 AHS Health Plan and Business Plan.
Data was updated as of May 17, 2021.
| Life Expectancy | 2017 | 2018 | 2019 | 2020 |
|---|---|---|---|---|
| The number of years a person would be expected to live, starting at birth, on the basis of mortality statistics. | ||||
| Provincial | 81.7 | 81.9 | 82.3 | 81.2 |
| Females | 84.0 | 84.3 | 84.4 | 83.7 |
| Males | 79.5 | 79.6 | 80.2 | 78.9 |
| First Nations | 71.0 | 70.9 | 70.3 | 82.3 |
| Non-First Nations | 82.1 | 82.3 | 82.8 | 81.9 |
| Potential Years Of Life Lost | 2017 | 2018 | 2019 | 2020 |
|---|---|---|---|---|
| The total number of years not lived (per 1,000 population) by an individual who died before their 75th birthday. | ||||
| Both | 51 | 50.7 | 47.1 | 56.2 |
| Females | 38.3 | 37.1 | 35.5 | 41.2 |
| Males | 63.3 | 63.8 | 58.4 | 70.8 |
| Perinatal Mortality Rate By Population (single year) |
2017 | 2018 | 2019 | 2020 | ||||
|---|---|---|---|---|---|---|---|---|
| The number of full-term stillbirths and infants up to 7-days of age divided by the number of live births and stillbirths multiplied by 1,000. | ||||||||
| Provincial | 5.53 | 5.62 | 5.25 | 5.73 | ||||
| First Nations | 9.05 | 7.52 | 11.1 | 14.32 | ||||
| Non-First Nations | 5.37 | 5.49 | 4.9 | 5.17 | ||||
| Rate Gap | 3.68 | 2.03 | 6.2 | 9.15 | ||||
| Perinatal Mortality Rate By Population (three-year average) |
2015-2017 | 2016-2018 | 2017-2019 | 2018-2020 | ||||
|---|---|---|---|---|---|---|---|---|
| The number of full-term stillbirths and infants up to 7-days of age divided by the number of live births and stillbirths multiplied by 1,000. | ||||||||
| First Nations | 9.94 | 8.72 | 9.2 | 10.9 | ||||
| Non-First Nations | 4.94 | 5.06 | 5.25 | 5.19 | ||||
| Rate Gap | 5 | 3.66 | 3.95 | 5.71 | ||||
| Emergency Department (ED) | 2017-18 | 2018-19 | 2019-20 | 2020-21 |
|---|---|---|---|---|
| Total Number of ED Visits (all sites) | 2,101,629 | 2,056,631 | 2,062,527 | 1,552,016 |
| Percentage of Patients Treated and Admitted to Hospital Within 8 Hours (all sites) | 43.90% | 45.40% | 42.90% | 44.30% |
| Percentage of Patients Treated and Admitted to Hospital Within 8 Hours (busiest sites) | 35.50% | 37.90% | 35.90% | 38.00% |
| Percentage of Patients Treated and Discharged Within 4 Hours (all sites) | 76.00% | 74.40% | 72.20% | 71.80% |
| Percentage of Patients Treated and Discharged Within 4 Hours (busiest sites) | 60.1% | 58.70% | 55.10% | 57.50% |
| ED Time to Physician Initial Assessment (median) (busiest sites) (in hours) | 1.4 | 1.4 | 1.6 | 1.1 |
| Percentage of Patients Left Without Being Seen and Against Medical Advice | 4.30% | 4.50% | 5.10% | 4.00% |
| Acute Care | 2017-18 | 2018-19 | 2019-20 | 2020-21 |
|---|---|---|---|---|
| Hospital Discharges | 400,909 | 401,208 | 399,281 | 358,046 |
| Acute Care Occupancy: percentage of patient days in hospital compared to available bed days in the reporting period for top 16 AHS sites | 98.00% | 96.20% | 95.50% | 90.30% |
| Acute Length of Stay to Expected Length of Stay Ratio | 1.02 | 1.02 | 1.03 | 0.98 |
| Hospital-Acquired Clostridium difficile Infection Rate (per 10,000 patient days) | 3 | 2.5 | 2.6 | 2.6 |
| Hospital Standardized Mortality Ratio (HSMR) | 102 | 97 | 98 | 106 |
| 30-day Overall Unplanned Readmissions (medical, surgical, pediatric and obstetric) | 9.40% | 9.50% | 9.40% | 9.30% (Q3YTD) |
| Medical Readmissions Within 30 Days (risk adjusted) | 14.10% | 14.40% | 14.00% | 14.10% (Q3YTD) |
| Mental Health Readmissions Within 30 Days (risk adjusted) | 9.60% | 10.70% | 10.70% | 11.90% (Q3YTD) |
| Surgical Readmissions Within 30 Days (risk adjusted) | 6.50% | 6.60% | 6.50% | 6.40% (Q3YTD) |
| Heart Attack in Hospital Mortality Within 30 Days (risk adjusted) | 5.40% | 5.70% | 6.50% | 5.10% (Q3YTD) |
| Stroke in Hospital Mortality Within 30 Days (risk adjusted) | 12.80% | 12.40% | 12.40% | 12.60% (Q3YTD) |
| Percentage of Alternate Level of Care (ALC) Days | 17.50% | 16.50% | 15.40% | 15.20% |
| Patient Satisfaction with Hospital Experience* | 64.20% | 65.50% | 66.30% | 67.20% (Q3YTD) |
| Hand Hygiene Compliance Rate | 85.10% | 87.10% | 87.70% | 92.20% |
* The Patient Satisfaction measure was amended to include ratings of 9 or 10 on a scale from 0-10. Previous years also included ratings out of 8. Historical results have been restated using the new methodology.
| Surgery Wait Times in weeks | 2017-18 | 2018-19 | 2019-20 | 2020-21 | |
|---|---|---|---|---|---|
| Coronary Artery Bypass Graft (CABG) Ready To Treat (RTT) for Scheduled Surgeries | 50th Percentile (scheduled) | 6.6 | 7 | 7.7 | 9.3 |
| 90th Percentile (scheduled) | 22.2 | 19.4 | 15.2 | 24.8 | |
| Volume (scheduled) | 307 | 365 | 362 | 363 | |
| Volume (all) | 1,453 | 1,636 | 1,599 | 1,397 | |
| Cataract Surgery RTT | 50th Percentile (scheduled) | 14.9 | 16.9 | 18.3 | 19 |
| 90th Percentile (scheduled) | 38.6 | 48 | 49.3 | 53 | |
| Volume (scheduled 1st eye) | 24,393 | 24,824 | 27,370 | 26,565 | |
| Volume (all) | 39,340 | 40,554 | 45,236 | 44,289 | |
| Hip Replacement RTT | 50th Percentile (scheduled) | 18.1 | 18.9 | 19.3 | 25.1 |
| 90th Percentile (scheduled) | 36.7 | 38 | 39.9 | 54.6 | |
| Volume (scheduled) | 4,334 | 4,483 | 4,505 | 3,845 | |
| Volume (all) | 6,191 | 6,278 | 6,605 | 5,800 | |
| Knee Replacement RTT | 50th Percentile (scheduled) | 20.7 | 19.1 | 21.1 | 29.4 |
| 90th Percentile (scheduled) | 40.7 | 43.7 | 46.9 | 63.1 | |
| Volume (scheduled) | 6,202 | 6,492 | 6,100 | 5,063 | |
| Volume (all) | 6,558 | 6,617 | 6,233 | 5,125 | |
| Hip Fracture Repair: Percentage Within 48 Hours | 92.80% | 94.10% | 92.40% | 91.60% | |
Source: Volumes (scheduled) data comes from OR medical records; volumes (all) data comes from administrative databases.
Notes:
| Surgeries Performed Within CIHI Benchmark | 2017-18 | 2018-19 | 2019-20 | 2020-21 | |
|---|---|---|---|---|---|
| Percentage of Scheduled Surgeries Performed Within CIHI Benchmark | Cataract | 53.30% | 48.20% | 45.10% | 44.50% |
| Hip | 70.50% | 68.50% | 65.50% | 51.60% | |
| Knee | 64.60% | 65.00% | 61.50% | 43.30% |
| Continuing Care | 2017-18 | 2018-19 | 2019-20 | 2020-21 |
|---|---|---|---|---|
| Total Number of People Placed into Continuing Care | 7,927 | 8,098 | 8,521 | 7,427 |
| Number of Patients Placed from Acute/Subacute Hospital Bed into Continuing Care | 5,218 | 5,005 | 5,113 | 4,663 |
| Number of Clients Placed from Community (at home) into Continuing Care | 2,709 | 3,093 | 3,408 | 2,764 |
| Average Wait Time for Continuing Care Placement (in days) | 62 | 61 | 54 | 55 |
| Average Wait Time in Acute/Subacute Care Hospital Bed for Continuing Care Placement (in days) | 51 | 46 | 36 | 38 |
| Average Wait Time for Long-Term Care Placement (in days) | 46 | 39 | 35 | 49 |
| Average Wait Time for Supportive Living Placement (in days) | 86 | 95 | 80 | 77 |
| Total Number Waiting for Continuing Care Placement | 1,937 | 1,508 | 1,412 | 1,427 |
| Number of Persons Waiting in Acute/Subacute Hospital Bed for Continuing Care Placement | 676 | 474 | 410 | 422 |
| Number of Persons Waiting in Community (at home) for Continuing Care Placement | 1,261 | 1,034 | 1,002 | 1,005 |
| Number of Unique Home Care Clients* | 114,874 | 119,974 | 125,143 | 118,093 |
| Percentage Placed in Continuing Care Within 30 Days | 51.80% | 57.90% | 60.00% | 61.30% |
The methodology for calculating the Number of Unique Home Care Clients was changed in 2020-21 to align with other provincial reporting; historical numbers have been restated.
| Primary Health Care | 2017-18 | 2018-19 | 2019-20 | 2020-21 |
|---|---|---|---|---|
| Albertans Enrolled in a Primary Care Network | 82% | 81% | 81% | 80% |
| Ambulatory Care Sensitive Conditions: rate of hospital admissions for health conditions that may be prevented or managed by appropriate primary healthcare (per 100,000 people) | 320 | 311 | 303 | 227 |
| Family Practice Sensitive Conditions: percentage of emergency department or urgent care visits for health conditions that may be appropriately managed at a family physician’s office | 21.40% | 20.50% | 20.70% | 16.20% |
| Number of Health Link calls* | 706,280 | 694,313 | 891,931 | 2,291,243 |
| Percentage of Health Link Calls Answered Within Two Minutes | 73% | 74% | 60% | 49% |
* Health Link call volumes include COVID-19 inquiries and vaccination appointment booking (beginning 2019-20 Q4).
| Children’s Mental Health Services | 2017-18 | 2018-19 | 2019-20 | 2020-21 |
|---|---|---|---|---|
| Percentage of Children (aged 0 to 17 years) Offered Scheduled Mental Health Treatment* | 74% | 82% | Not available | Not available |
| Percentage of Children (aged 0 to 17 years) Receiving Scheduled Mental Health Treatment* | 67% | 72% | 75% (Q3YTD) |
Not available |
| Child and Youth Mental Health Wait Times (90th percentile) (in days) | 53 | 48 | 55 | 48 (Q3YTD) |
| Child and Youth Mental Health Wait Times (median) (in days) | 15 | 14 | 15 | 14 (Q3YTD) |
* Data is no longer available due to clinical information system upgrades; measures were replaced with wait time metrics.
| Influenza Immunization | 2017-18 | 2018-19 | 2019-20 | 2020-21 |
|---|---|---|---|---|
| Seasonal Influenza Immunizations | 1,229,350 | 1,317,659 | 1,438,866 | Not Available |
| Seniors (65+ years) | 60.1% | 61.20% | 61.40% | Not Available |
| Children (6 to 23 months) | 34.60% | 40.70% | 43.20% | Not Available |
| AHS Healthcare Workers | 66.00% | 67.60% | 67.20% | 64.80% |
Note: 2020-21 influenza immunization data was not available at the time of reporting; data will be updated as soon as possible.
| COVID-19 Immunization | 2017-18 | 2018-19 | 2019-20 | 2020-21 |
|---|---|---|---|---|
| Total Alberta Residents who Received the COVID-19 Vaccination (at least first dose)* | n/a | n/a | n/a | 568,947 |
* Immunizations for COVID-19 began in 2020-21 Q3.
| Childhood Immunization | 2017-18 | 2018-19 | 2019-20 | 2020-21 |
|---|---|---|---|---|
| Childhood Immunization Rate - DTaP-IPV-Hib | 77.80% | 77.70% | 78.60% | 76.40% |
| Childhood Immunization Rate – MMR | 86.90% | 86.50% | 87.90% | 86.40% |
| Cancer Screening | 2017-18 | 2018-19 | 2019-20 | 2020-21 |
|---|---|---|---|---|
| Breast Cancer Participating Rate | 64.40% | 65.20% | 60.1% | Not available |
| Colorectal Cancer Participating Rate* | 55.60% | 55.70% | 50.60% | Not available |
| Cervical Cancer Participating Rate | 64.30% (2016-18) |
63.60% (2017-19) |
60.40% (2018-20) |
Not available |
| Early Detection of Cancers | 71.20% -2017 |
74.50% -2018 |
74.60% -2019 |
Not available |
* Historical data was updated due to methodology updates to capture both FIT tests and sigmoidoscopy/colonoscopy procedures.
Note: Cancer screening participation rate measures are lagged and data was not available at the time of this report.
| Cancer Care in weeks, 90th percentile | 2017-18 | 2018-19 | 2019-20 | 2020-21 |
|---|---|---|---|---|
| Radiation Oncology Access: referral to first consult (from referral to the time of their first appointment with a radiation oncologist) | 5 | 6.7 | 7 | 5.6 |
| Medical Oncology Access: referral to first consult (from referral to the time of their first appointment with a medical oncologist) | 5.6 | 6.1 | 7 | 5.9 |
| Radiation Therapy Access: ready to treat to first therapy | 2.7 | 2.7 | 2.9 | 2.9 |
| System Sustainability | 2017-18 | 2018-19 | 2019-20 | 2020-21 |
|---|---|---|---|---|
| Annual Rate of Change in Operational Expenditures* | 2.50% | 3.70% | 1.80% | -1.20% |
| Cost of a Standard Hospital Stay (in dollars) | $7,907 | $8,031 | $8,169 | $9,380 |
* Change in total annual expenditures, excluding COVID-19 costs.
| AHS Workforce | 2017-18 | 2018-19 | 2019-20 | 2020-21 |
|---|---|---|---|---|
| AHS Workforce Engagement Rate* | No survey | No survey | 3.57 | No survey |
| Disabling Injury Rate (per 100FTE) | 4.11 | 4.12 | 4.14 | 5.06 (Q3YTD) |
* Baseline results for the AHS Workforce Engagement Rate were based on 2016-17 survey results (3.46 out of 5).
| Access to Information | 2017-18 | 2018-19 | 2019-20 | 2020-21 |
|---|---|---|---|---|
| MyAHS Connect Portal Users* | n/a | n/a | 9.461 | 38.017 |
* Connect Care launched in 2019-20 Q3. Prior data is not available.
The numbers below provide a snapshot of AHS’ activity during the 2020-21 fiscal year.
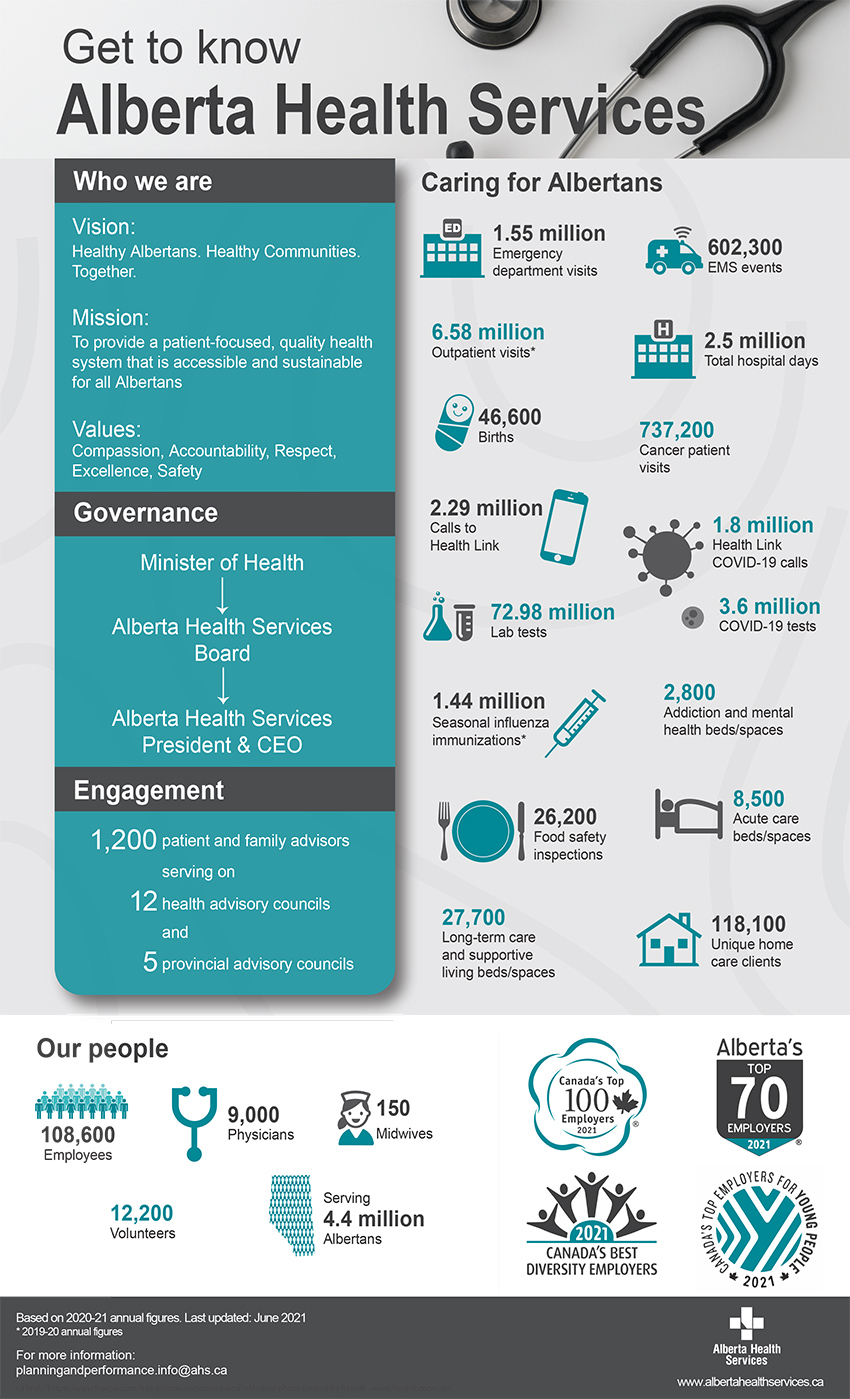
AHS continues to shift from a focus on providing care in hospitals and care facilities to providing resources and services in the community. We are committed to providing community-based care options for Albertans, including long-term care, designated supportive living, palliative care and home care.
| Number of Beds/Spaces | 31-Mar-20 | 31-Mar-21 | Difference | % Change |
|---|---|---|---|---|
| Acute Care | ||||
| Acute Care | 8,502 | 8,513 | 11 | 0.1% |
| Total Acute Care | 8,502 | 8,513 | 11 | 0.1% |
| Addiction & Mental Health | ||||
| Psychiatric (stand-alone facilities) | 928 | 928 | 0 | 0.0% |
| Addiction Treatment | 979 | 1,037 | 58 | 5.9% |
| Community Mental Health | 878 | 875 | -3 | -0.3% |
| Total Addiction & Mental Health | 2,785 | 2,840 | 55 | 2.0% |
| Community-Based Care | ||||
| Continuing Care – Long-Term Care (LTC) | ||||
| Auxiliary Hospital | 5,561 | 5,591 | 30 | 0.5% |
| Nursing Home | 10,104 | 10,209 | 105 | 1.0% |
| Sub-Total Long-Term Care | 15,665 | 15,800 | 135 | 0.9% |
| Continuing Care – Designated Supportive Living (DSL) | ||||
| Designated Supportive Living 3 | 1,513 | 1,513 | 0 | 0.0% |
| Designated Supportive Living 4 | 6,840 | 6,924 | 84 | 1.2% |
| Designated Supportive Living 4 - Dementia | 3,500 | 3,479 | -21 | -0.6% |
| Sub-Total Designated Supportive Living | 11,853 | 11,916 | 63 | 0.5% |
| Sub-Total Long-Term Care & Designated Supportive Living | 27,518 | 27,716 | 198 | 0.7% |
| Community Palliative and Hospice (out-of-hospital) | 256 | 257 | 1 | 0.4% |
| Total Continuing Care (includes LTC, DSL and Palliative Care) | 27,774 | 27,973 | 199 | 0.7% |
| Sub-acute in Auxiliary Hospitals | 472 | 477 | 5 | 1.1% |
| Total Community-Based Care (includes LTC, DSL, Palliative Care and Sub-Acute in Auxiliary Hospitals) | 28,246 | 28,450 | 204 | 0.7% |
| Provincial Total | 39,533 | 39,803 | 270 | 0.7% |
To keep pace with population growth and aging, AHS needs to target increasing community capacity by approximately 1,000 designated spaces annually. This enables us to place clients in appropriate care settings within clinically-appropriate timeframe.
| Number of Facilities | South Zone | Calgary Zone | Central Zone | Edmonton Zone | North Zone | Provincial |
|---|---|---|---|---|---|---|
| Community Ambulatory Care | ||||||
| Urgent Care Centres | - | 5 | - | 1 | - | 6 |
| Ambulatory Care Centres | 2 | 2 | 2 | 1 | 3 | 10 |
| Primary Care Networks | 2 | 7 | 12 | 8 | 11 | 40 |
| Public Health Centres | 17 | 25 | 31 | 24 | 51 | 148 |
| Addiction & Mental Health | ||||||
| Addiction | 6 | 11 | 6 | 10 | 6 | 39 |
| Community Mental Health* | 6 | 15 | 2 | 26 | 1 | 50 |
| Community Mental Health Sites with Multiple Locations * The number of facilities for Community Mental Health does not include contracted sites with multiple locations. These facilities are also noted in Zone Beds by Facility. |
- | 2 | - | 2 | - | - |
| Standalone Psychiatric | - | 2 | 1 | 2 | - | 5 |
| Hospital Acute Care | ||||||
| Urban | - | 5 | - | 5 | - | 10 |
| Regional | 2 | - | 1 | - | 2 | 5 |
| Community | 9 | 8 | 29 | 7 | 31 | 84 |
| Standalone Emergency Departments | 2 | - | - | 2 | 1 | 5 |
| Ambulatory Endoscopy or Surgical Centre Hospital | 1 | 1 | - | - | - | 2 |
| Total Designated Hospitals | 14 | 14 | 30 | 14 | 34 | 106 |
| Cancer Care | ||||||
| Cancer Centres | 2 | 3 | 5 | 1 | 6 | 17 |
| Community-Based Care | ||||||
| Long-Term Care & Designated Supportive Living (3, 4, Dementia, Mental Health and Restorative Care) | 51 | 76 | 79 | 92 | 61 | 359 |
| Additional contracted care sites not included in above number reflect the number of personal care, special care and family care homes | - | 53 | - | 55 | - | 108 |
| Community Hospice, Palliative & End-of-Life Care | 2 | 8 | 3 | 6 | 4 | 23 |
Source: AHS Bi-Annual Bed Survey as of March 31, 2021.